Changing our diet for a wilder world
This short essay explores how a plant-based or vegan diet could drastically transform our land use to improve and protect biodiversity by allowing the creation of new wilderness areas.
It focuses on Western Europe (Austria, Belgium, France, Germany, Liechtenstein, Luxembourg, Monaco, Netherlands, Switzerland) using data from the Food and Agriculture Organization (FAO) of the United Nations, but it could be transposed to other industrialized regions with the same conclusions. All tables were generated by a script published on GitHub.
Population
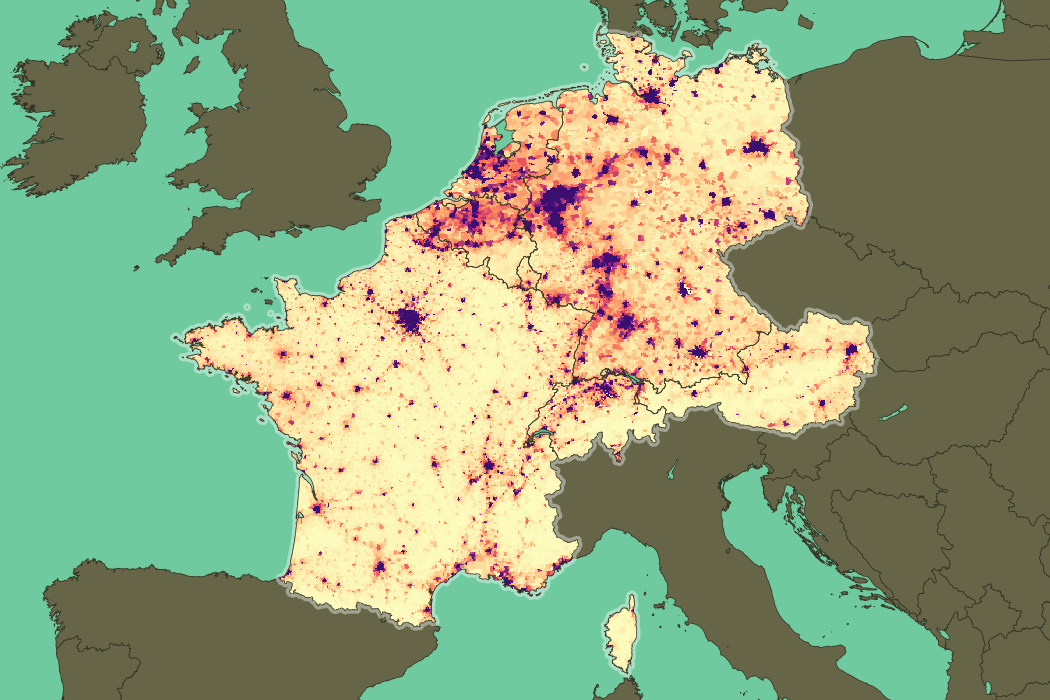 Human density in Western Europe (GPW v4.10)
Western Europe was home to 191 million humans in 2013 and the population should stabilize around 200 million by the year 2040. At the same time 573 million chickens, 65 million pigs, and 42 million cattle, among other animals, were raised in farms to feed the human population.
| Item | Population |
|---|---|
| Humans | 190.51 |
| Livestock | 765.51 |
| .. Pigs | 64.54 |
| .. Cattle | 41.85 |
| .. Sheep | 11.07 |
| .. Goats | 2.04 |
| .. Chickens | 572.72 |
| .. Turkeys | 35.14 |
| .. Ducks | 30.08 |
| .. Other | 8.08 |
Over the past half a century the total number of poultry has been increasing steadily whereas the number of cattle and sheep peaked 30 years ago.
During the same period the human population of Western Europe has become more and more urban, with 78% of the people living in cities in 2013 compared to 69% in 1963. In other words the rural population decreased by 9 million while the urban population increased by 42 million.
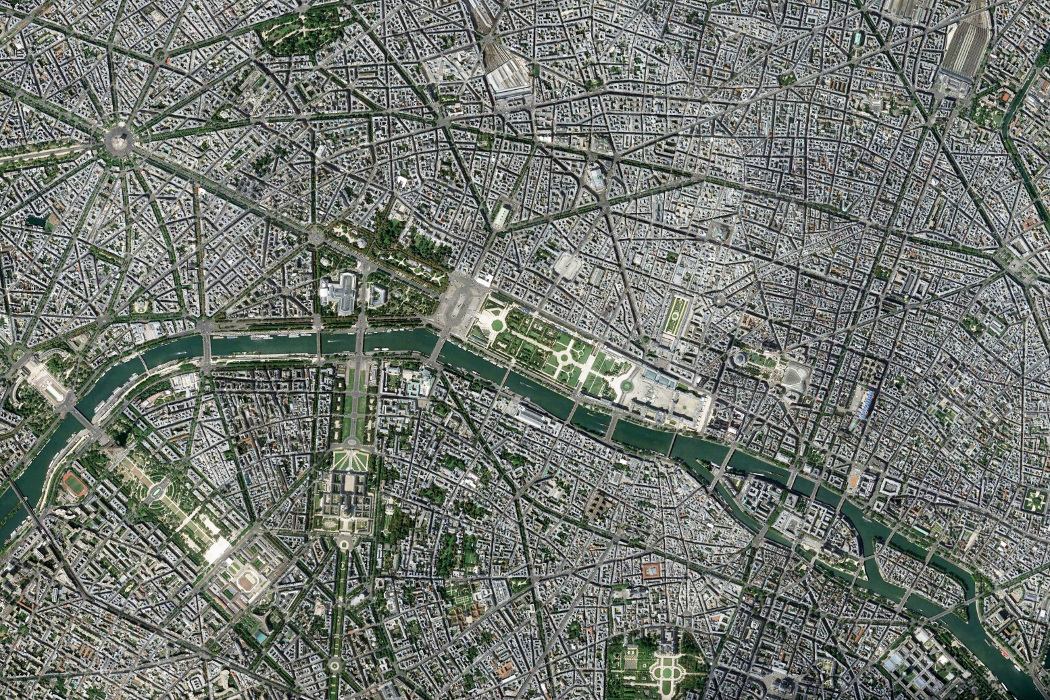 Paris, France (Google Maps)
Land Use
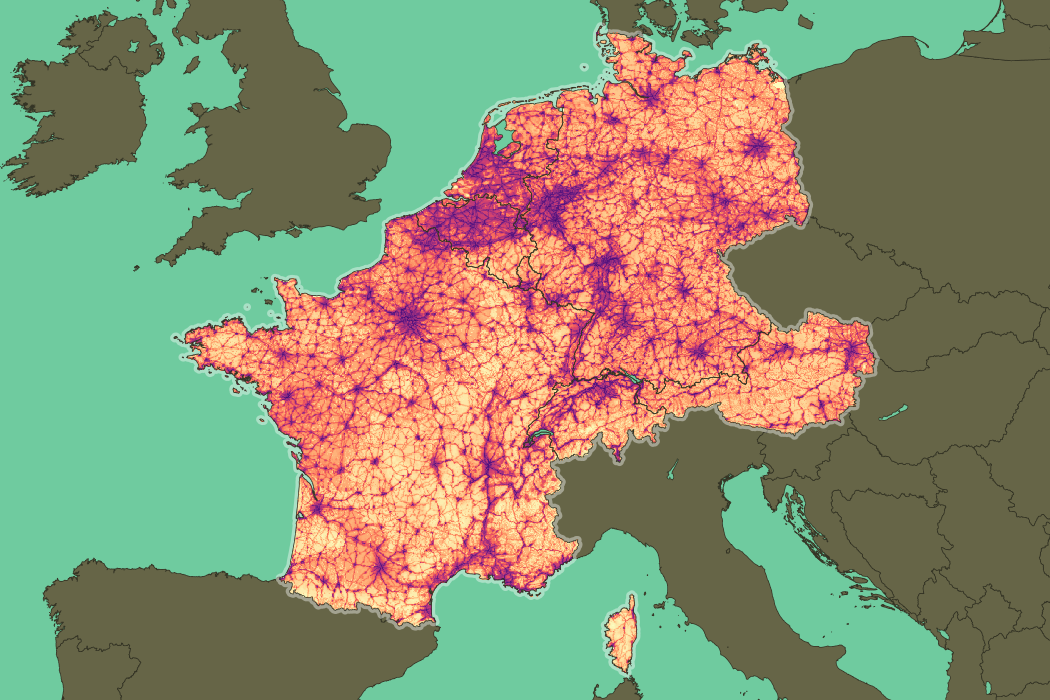 Human footprint on Western Europe (LWP v3)
Western Europe has a land area of 109 million hectares. Most of it was covered by deciduous trees before human settlement and the beginning of agriculture, but nowadays the forests are reduced to 34 million hectares while crops and pastures use 28 and 25 million hectares respectively.
| Item | Area |
|---|---|
| Land | 108.52 |
| .. Crops | 28.48 |
| ..\... Permanent crops | 1.35 |
| ..\... Temporary crops | 26.40 |
| ..\... Fallow land | 0.74 |
| .. Pastures | 24.55 |
| ..\... Permanent meadows and pastures | 17.83 |
| ..\... Temporary meadows and pastures | 6.72 |
| .. Forests | 34.44 |
| ..\... Primary forests | 0.16 |
| ..\... Planted forests | 9.97 |
| ..\... Naturally regenerated forests | 24.31 |
| .. Other | 21.05 |
The pastures are grazed by cattle, sheep, and goats, while most chickens and pigs are kept indoors. Crops produce food for both humans and their livestock.
A closer look at the current forests shows that there is virtually no wilderness left in Western Europe, it is one of the most endangered ecosystem in the world. The vast majority of the remaining forests are heavily exploited and about a third of them are reduced to monoculture tree plantations.
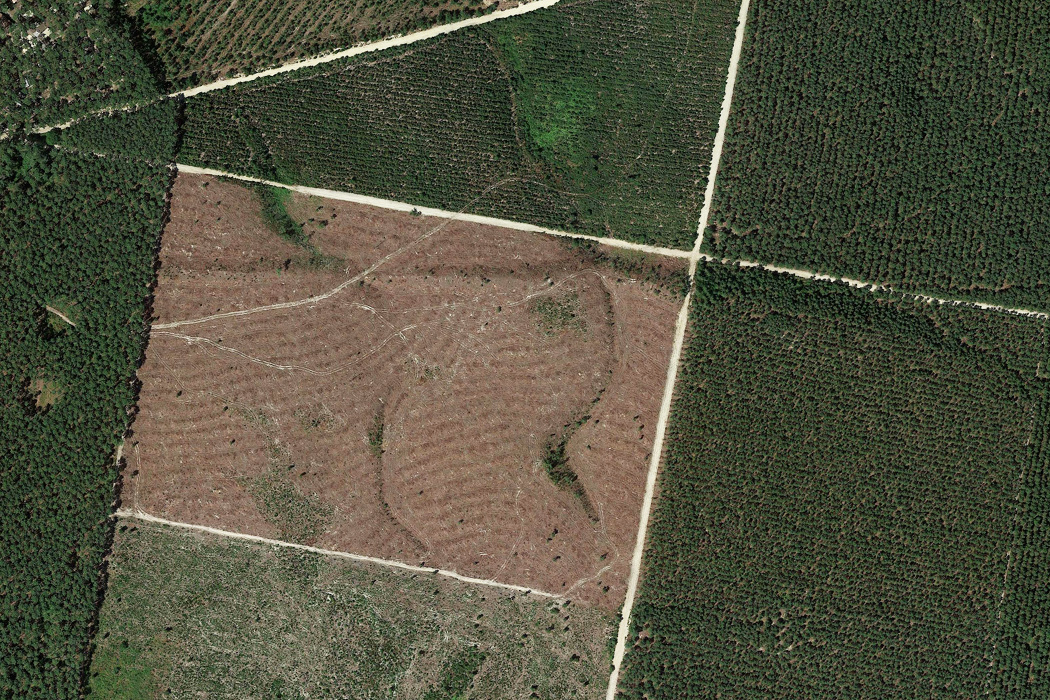 Pine plantations, Landes, France (Google Maps)
Crops
The majority of the area used for crops is dedicated to the cultivation of cereals. In 2013 more than 126 million tonnes of grain were harvested on less than 18 million hectares. With 4 million more hectares dedicated to oils production and less than 3 million for the remaining plants (fruits, roots, vegetables).
| Item | Prod | Area |
|---|---|---|
| Crops | 269.31 | 25.38 |
| .. Cereals | 125.79 | 17.56 |
| .. Oils | 12.60 | 4.03 |
| .. Fruits | 13.12 | 1.18 |
| .. Sugars | 71.84 | 0.95 |
| .. Roots | 27.65 | 0.67 |
| .. Vegetables | 16.13 | 0.51 |
| .. Pulses | 1.10 | 0.32 |
| .. Fibres | 0.55 | 0.08 |
| .. Nuts | 0.08 | 0.04 |
| .. Spices | 0.03 | 0.02 |
| .. Drinks | 0.41 | 0.01 |
| .. Other | 0.02 | 0.01 |
NOTE: The area of crops on this table (25M hectares) differs from the previous table (28M hectares), see: QC Methodology (FAOSTAT)
The next table details the allocation of each type of crops to human food (processed or directly) and to livestock feed. As before, the numbers are expressed in million of tonnes.
| Item | Prod | Supply | Proc | Food | Feed | Other |
|---|---|---|---|---|---|---|
| Crops | 303.17 | 315.21 | 111.00 | 100.82 | 65.44 | 38.23 |
| .. Cereals | 125.96 | 104.03 | 9.70 | 22.05 | 60.52 | 11.76 |
| .. Sugars | 71.82 | 72.15 | 66.43 | 0.00 | 0.00 | 5.72 |
| .. Roots | 27.61 | 20.32 | 0.92 | 11.99 | 1.77 | 5.64 |
| .. Drinks | 24.57 | 24.24 | 0.85 | 21.36 | 0.00 | 2.04 |
| .. Oils | 21.78 | 40.55 | 24.87 | 4.27 | 1.99 | 9.58 |
| .. Vegetables | 17.02 | 21.42 | 0.00 | 18.72 | 0.40 | 2.36 |
| .. Fruits | 13.25 | 29.92 | 8.24 | 20.66 | 0.00 | 1.05 |
| .. Pulses | 1.09 | 1.21 | 0.00 | 0.40 | 0.76 | 0.06 |
| .. Nuts | 0.07 | 1.16 | 0.00 | 1.15 | 0.00 | 0.02 |
| .. Spices | 0.00 | 0.20 | 0.00 | 0.22 | 0.00 | 0.00 |
NOTE: Some items on this table differ from the previous table. For example beers and wines are now excluded from cereals and fruits respectively and counted in drinks.
Most of the crops used to feed livestock are cereals. Of the 104 million tonnes available in the domestic supply, about 1/3 goes to human food and 2/3 to livestock feed.
Furthermore, as supply is defined by production and import subtracted by export and changes in stocks, assuming the same balance for the 126 million tonnes of cereals produced, we can estimate that about 11 million hectares of cereal crops out of 18 according to the previous table were used to feed livestock.
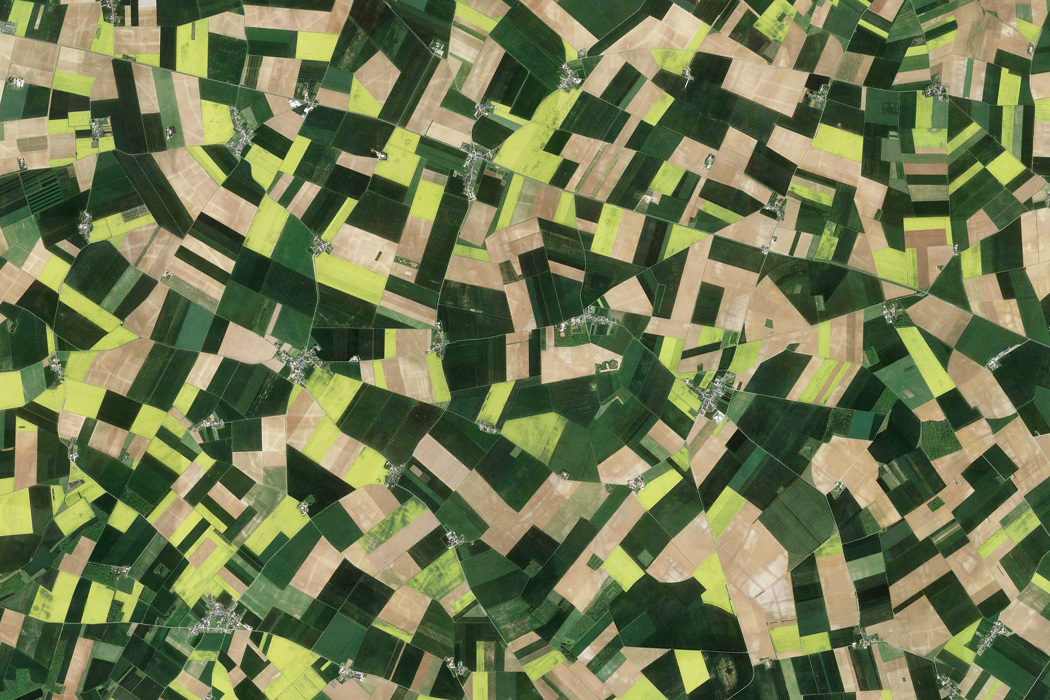 Cereal fields, Beauce, France (Google Maps)
Diet
When we look at the food supply (in kcal/capita/day) we see that animal and vegetal products represent respectively 1/3 and 2/3 of the current diet in Western Europe:
| Item | Calories |
|---|---|
| Animal Products | 1109 |
| .. Meat | 514 |
| .. Dairy | 492 |
| .. Eggs | 49 |
| .. Seafood | 54 |
| Vegetal Products | 2387 |
| .. Cereals | 882 |
| .. Oil | 483 |
| .. Sugar | 431 |
| .. Drinks | 219 |
| .. Fruits | 117 |
| .. Roots | 114 |
| .. Vegetables | 74 |
| .. Nuts | 40 |
| .. Pulses | 19 |
| .. Other | 8 |
In terms of calories available to humans, converting pastures and crops to animal products is much less efficient than directly consuming those crops in the first place.
It should be noted that some of the land used for pastures is not suitable for growing crops, but with 2/3 of the crops in Western Europe used to feed livestock, and the 1/3 remaining providing 2/3 of the calories consumed by the human population, more than enough crops area is available to replace all animal products with vegetable products.
Plant-based diets have a long history around the world and the modern widespread availability of dietary supplements (vitamin B12 most notably) means that a strict vegan diet, properly planned, can be as healthy as any omnivore diets.
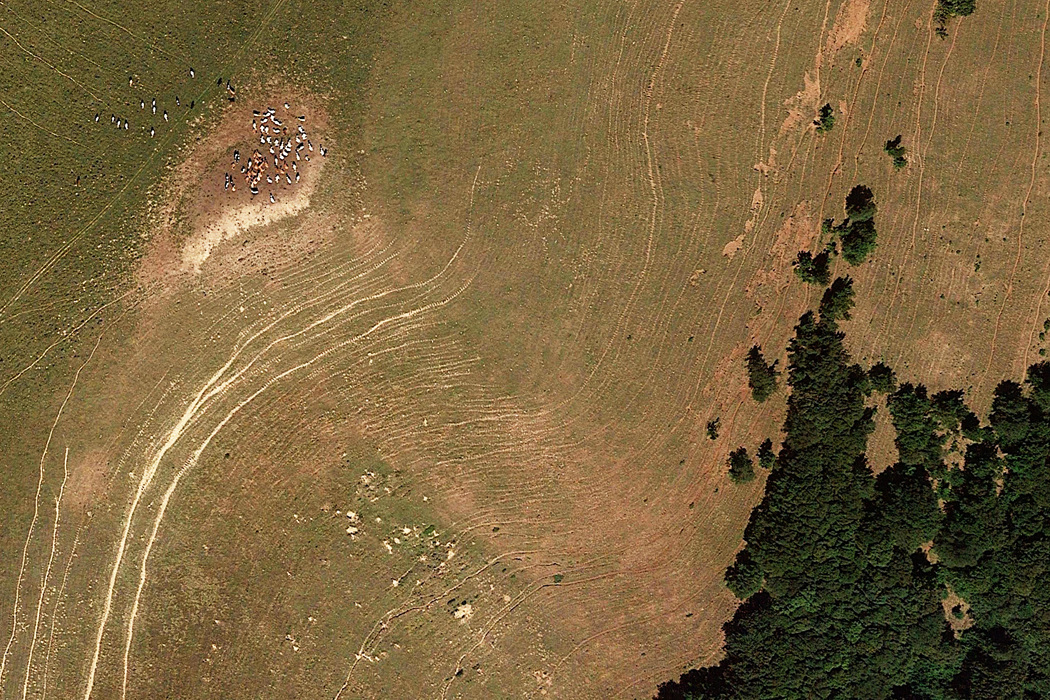 Cattle in a pasture, Alps, France (Google Maps)
Conclusion
If all the human population of Western Europe shifted to a plant-based diet, most of the 25 million hectares of pasture and at least a third of the 28 million hectares of crops that are used to feed the livestock could be freed from agriculture while the remaining cropland would be reorganized to prioritize direct human consumption.
The result of this change, after rewilding the land, could double the amount of forests and provide a lot of the space required to protect biodiversity.
A full conversion of the population to a plant-based diet may seems utopian at the moment, but even a moderate shift toward less meat consumption would progressively allow the creation of more natural reserves.
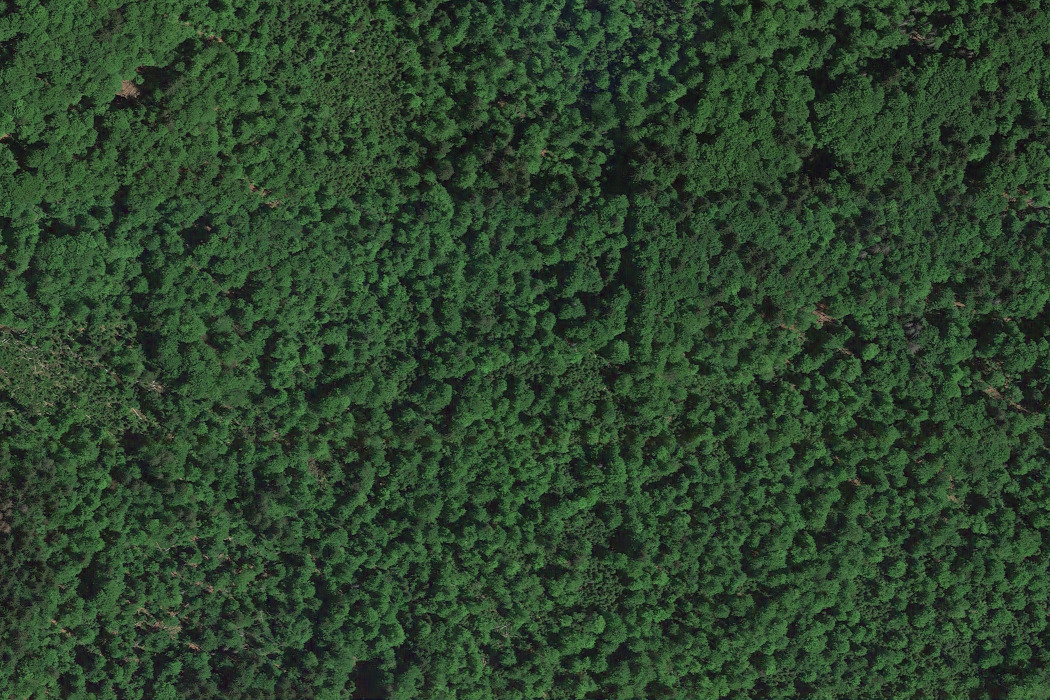 Bavarian Forest, Germany (Google Maps)
Annexes
Below are the same tables generated for the whole world (FAOSTAT 2013), mostly equivalent to this great data visualization from Our World In Data.
In less industrialized areas there are more remaining forests, crops take less space than pastures and are less used to feed the livestock, and humans eat less animal products. But the population is still growing and adopting more and more a lifestyle similar to Western Europe.
World populations (in million):
| Item | Population |
|---|---|
| Humans | 7,213.43 |
| Livestock | 28,156.90 |
| .. Cattle | 1,434.40 |
| .. Pigs | 976.34 |
| .. Sheep | 1,132.72 |
| .. Goats | 954.72 |
| .. Chickens | 20,955.42 |
| .. Ducks | 1,111.52 |
| .. Turkeys | 450.87 |
| .. Other | 1,140.92 |
World land use (in million hectares):
| Item | Area |
|---|---|
| Land | 13,021.25 |
| .. Arable land and permanent crops | 1,571.97 |
| .. Permanent meadows and pastures | 3,309.64 |
| .. Forests | 4,005.75 |
| ..\... Naturally regenerated forests | 2,437.26 |
| ..\... Planted forests | 286.93 |
| ..\... Primary forests | 1,281.56 |
| .. Other | 4,133.88 |
World crops areas (in million tonnes and hectares):
| Item | Prod | Area |
|---|---|---|
| Crops | 8,665.04 | 1,400.50 |
| .. Cereals | 2,768.02 | 722.32 |
| .. Oils | 809.58 | 261.92 |
| .. Pulses | 77.97 | 80.01 |
| .. Fruits | 823.66 | 63.56 |
| .. Roots | 817.52 | 61.46 |
| .. Vegetables | 997.84 | 54.52 |
| .. Other | 97.05 | 48.77 |
| .. Fibres | 78.59 | 35.32 |
| .. Sugars | 2,150.31 | 31.39 |
| .. Drinks | 19.18 | 24.34 |
| .. Nuts | 14.93 | 11.13 |
| .. Spices | 10.37 | 5.77 |
World crops balance (in million tonnes):
| Item | Prod | Supply | Proc | Food | Feed | Other |
|---|---|---|---|---|---|---|
| Crops | 8,436.27 | 8,289.18 | 2,191.64 | 3,532.90 | 1,196.12 | 1,376.78 |
| .. Cereals | 2,523.35 | 2,407.01 | 94.58 | 1,029.02 | 873.55 | 410.48 |
| .. Sugars | 2,126.84 | 2,128.23 | 1,593.75 | 32.25 | 39.74 | 462.50 |
| .. Vegetables | 1,129.61 | 1,124.93 | 0.24 | 982.97 | 51.71 | 90.41 |
| .. Roots | 811.32 | 815.70 | 15.44 | 443.35 | 175.29 | 181.80 |
| .. Oils | 753.37 | 726.49 | 431.79 | 131.50 | 40.20 | 128.35 |
| .. Fruits | 662.13 | 661.60 | 53.30 | 544.88 | 2.45 | 62.08 |
| .. Drinks | 315.13 | 312.24 | 2.53 | 279.48 | 0.00 | 30.49 |
| .. Pulses | 82.67 | 81.50 | 0.00 | 59.20 | 13.19 | 9.22 |
| .. Nuts | 16.93 | 16.80 | 0.00 | 16.41 | 0.00 | 0.57 |
| .. Spices | 14.94 | 14.68 | 0.00 | 13.85 | 0.00 | 0.89 |
World diet:
| Item | Calories |
|---|---|
| Animal Products | 514 |
| .. Meat | 273 |
| .. Dairy | 170 |
| .. Eggs | 36 |
| .. Seafood | 35 |
| Vegetal Products | 2371 |
| .. Cereals | 1292 |
| .. Oils | 331 |
| .. Sugars | 237 |
| .. Roots | 142 |
| .. Fruits | 98 |
| .. Vegetables | 96 |
| .. Pulses | 79 |
| .. Drinks | 75 |
| .. Nuts | 16 |
| .. Other | 5 |
References
- Gerbens-Leenes, P. W., and Sanderine Nonhebel. "Consumption patterns and their effects on land required for food" Ecological Economics 42.1-2 (2002): 185-199.
- Scarborough, Peter, et al. "Dietary greenhouse gas emissions of meat-eaters, fish-eaters, vegetarians and vegans in the UK" Climatic change 125.2 (2014): 179-192.
- Sabaté, Joan, and Sam Soret. "Sustainability of plant-based diets: back to the future" The American journal of clinical nutrition 100.suppl_1 (2014): 476S-482S.
- Aleksandrowicz, Lukasz, et al. "The impacts of dietary change on greenhouse gas emissions, land use, water use, and health: a systematic review" PloS one 11.11 (2016): e0165797.
- Erb, Karl-Heinz, et al. "Exploring the biophysical option space for feeding the world without deforestation" Nature communications 7 (2016): 11382.